Nintendo's comeback in numbers: from operating losses to record sales
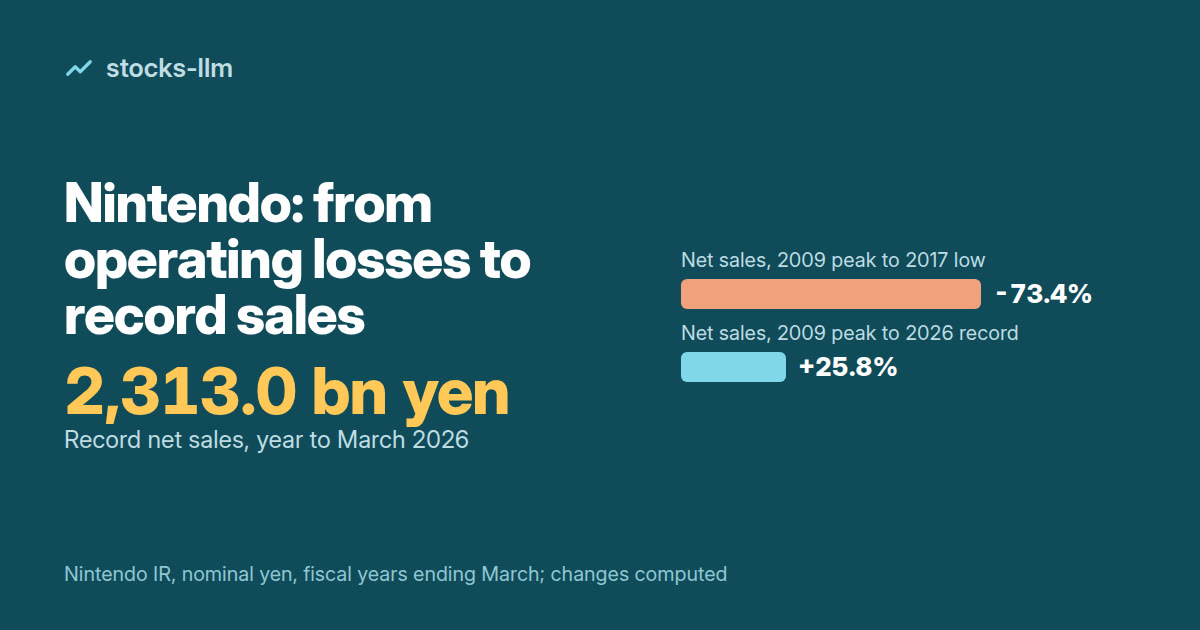
Nintendo went from three straight years of operating losses to record sales: net sales reached 2,313.0 billion yen in the fiscal year to March 2026, the highest in its published figures since 1981 and about 26% above the Wii-era peak of 1,838.6 billion yen in the year to March 2009. All figures are Nintendo's own consolidated results in nominal yen, not adjusted for inflation.
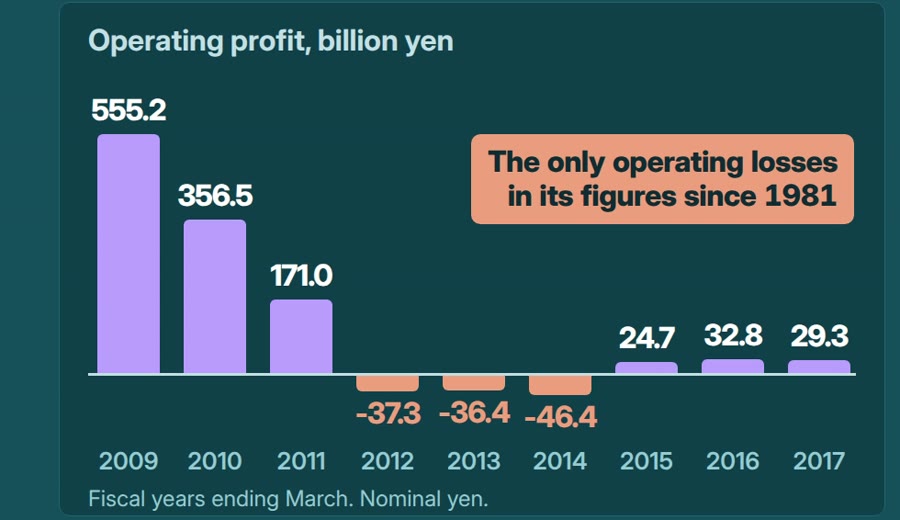
The company is older than its consoles. Nintendo began making playing cards in 1889 and launched its first home video game machines in 1977. Its published income series starts in the fiscal year to August 1981, when net sales were 23.9 billion yen, and by the year to March 1993 they had reached 634.6 billion yen. The DS and Wii years then lifted sales to the 2009 peak, with operating profit of 555.2 billion yen that year.
After that peak, the numbers slid. Operating profit is what remains of sales after the cost of making products and running the business, before interest, investments and tax. It fell to 37.3, 36.4 and 46.4 billion yen of operating losses in the three fiscal years to March 2014, the only operating losses in Nintendo's published figures since 1981. Net sales fell 73.4% from the 2009 peak to the year to March 2017, when they bottomed at 489.0 billion yen.
Hardware unit counts show the same gap. Nintendo reports life-to-date units on a sell-in basis, meaning units shipped by Nintendo, not units bought by consumers. As of June 30, 2026, the Wii U had sold 13.56 million units against 101.63 million for the Wii. Nintendo's 2014 annual report said "the Wii U business as a whole showed slow growth." The Wii U launched in November 2012, inside the second loss year, so it does not explain the first one, and no single cause is stated here.
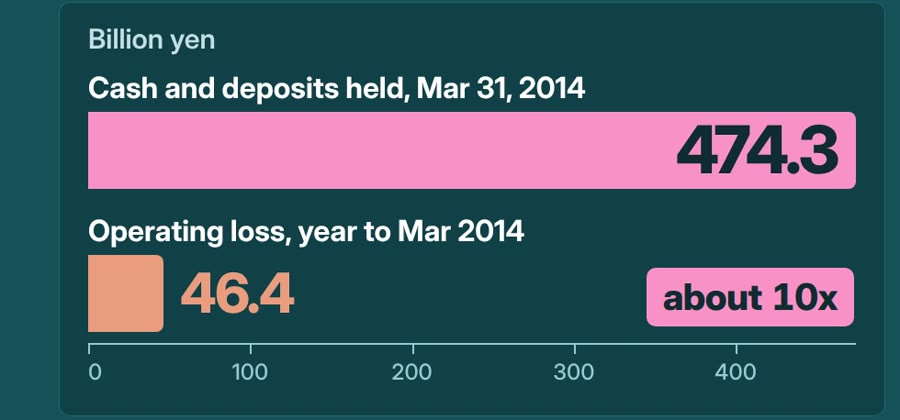
A common retelling says the losses left Nintendo short of money. The balance sheet says otherwise. On March 31, 2014, at the end of the worst loss year, Nintendo held 474.3 billion yen in cash and deposits, about 10 times that year's operating loss of 46.4 billion yen, and had loans of just 7 million yen. The comparison sets a balance held on one date against a flow over one year, which is why the two are labeled separately.
The turn came with Switch, launched in 2017 as a home console that can also be used as a handheld. Net sales grew 3.6 times from the year to March 2017 to the year to March 2021, and operating profit reached a record 640.6 billion yen in that year, an operating margin of 36.4%. Switch is Nintendo's best-selling hardware, at 156.59 million units life-to-date as of June 30, 2026, just ahead of the Nintendo DS at 154.02 million.
Today the sales record belongs to the Switch 2 year, but the profit record does not. Switch 2 sold 19.86 million units (sell-in) in the year to March 2026, operating profit was 360.1 billion yen, and the operating margin fell from 24.3% to 15.6%. Nintendo says hardware rose to 66.7% of platform sales from 43.7%, and Switch 2 has a lower profit margin than Switch.
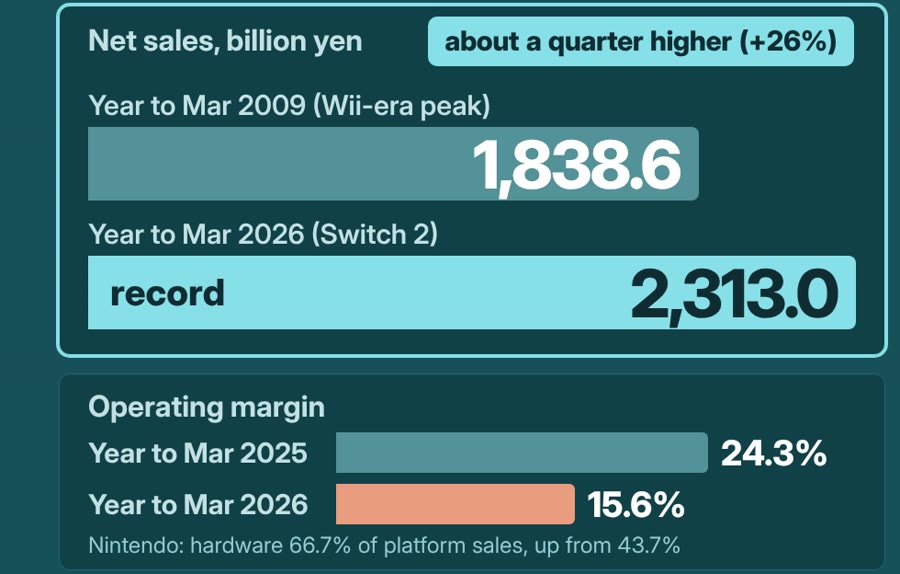
The mechanism is sales mix: a console launch year raises the hardware share of sales, and when the new hardware carries a lower margin than the old, record sales and a lower operating margin can arrive in the same year.
Watch the short video: YouTube
Sources
- Nintendo Co., Ltd., Company History
- Nintendo IR, Consolidated Statements of Income Transition, as of March 31, 2026
- Nintendo Annual Report, fiscal year ended March 31, 2014
- Nintendo IR, Dedicated Video Game Sales Units, as of June 30, 2026
- Nintendo Financial Results Explanatory Material, May 8, 2026