What Americans Spend on Their Pets: $158 Billion in 2025
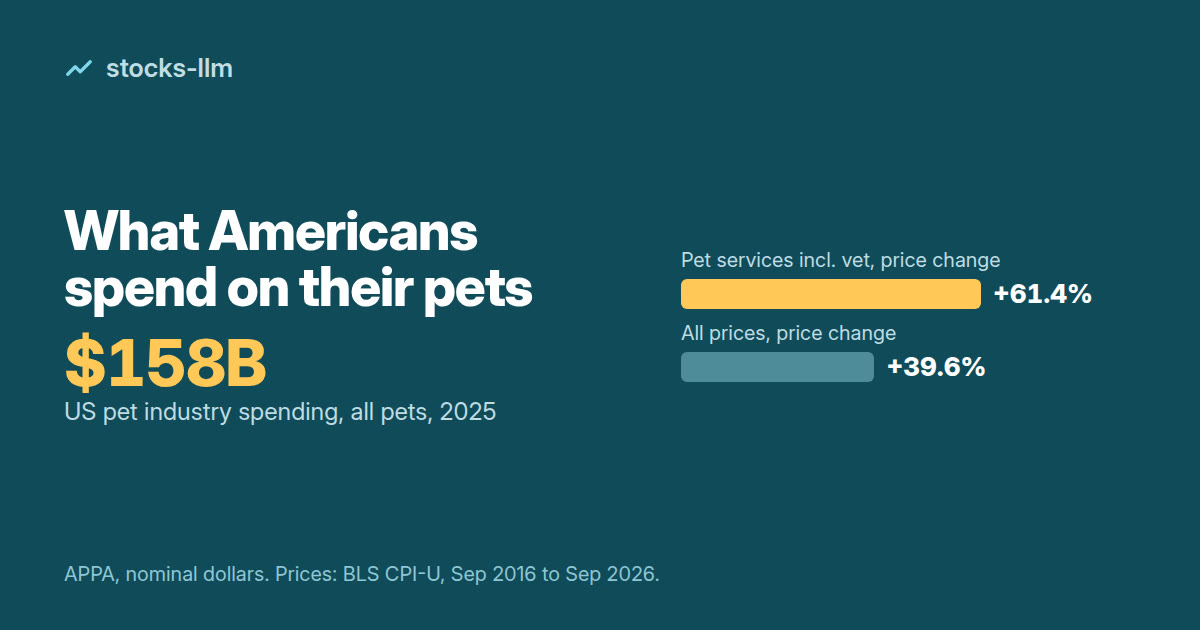
Americans spent about $158 billion on their pets in 2025, by the count of the American Pet Products Association (APPA). The biggest share went to food and treats at $68.3 billion, followed by vet care and products at $41.0 billion.
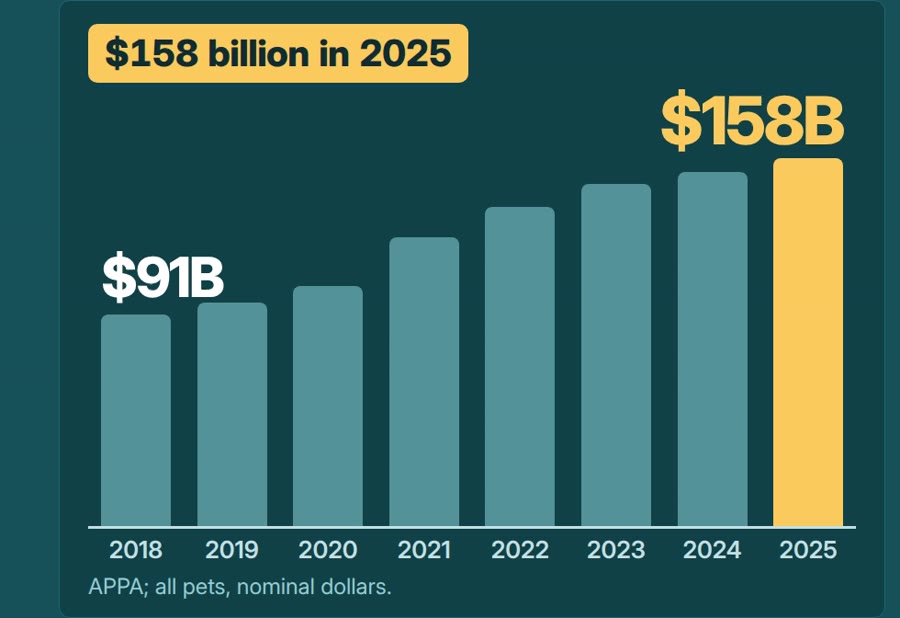
APPA is the trade group for the US pet products industry, and its yearly estimate covers all pets, not only dogs and cats: fish, birds, reptiles, small animals and live-animal sales are in the total. On its current published chart, spending was about $91 billion in 2018 and rose in each year shown to $158 billion in 2025. That is about 74% more over seven years, a computed figure (158 divided by 91). APPA counts 95 million US households that own at least one pet, with dogs in 71 million households and cats in 53 million.
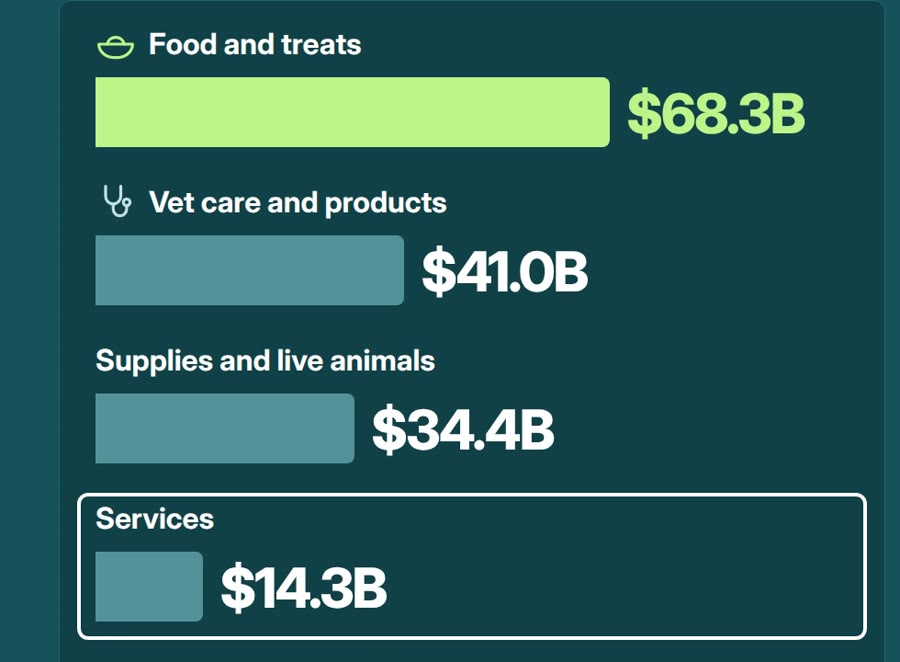
The 2025 total splits into four categories. Food and treats came to $68.3 billion. Vet care and product sales came to $41.0 billion. Supplies, live animals and over-the-counter medicine added $34.4 billion. Other services, which APPA defines as grooming, boarding, insurance, training, sitting and walking, added $14.3 billion. Comparing each category with APPA's 2021 figures gives the growth rates, all computed: services rose 51% from $9.5 billion, food 37% from $50.0 billion, vet care 20% from $34.3 billion and supplies 15% from $29.8 billion. Services are the smallest category but grew fastest.
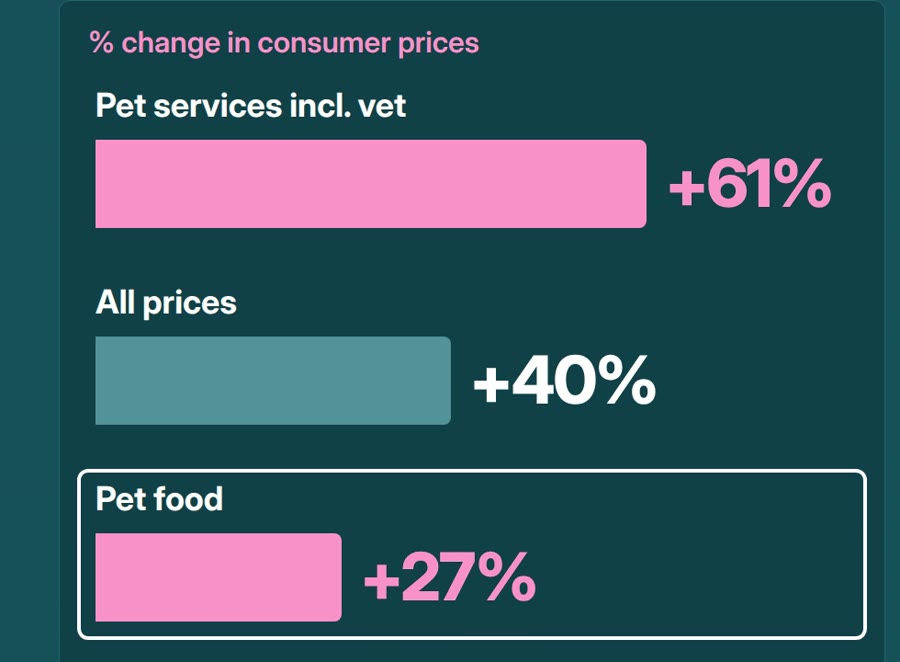
A common misreading is to treat the 74% as 74% more pet food, toys or vet visits. APPA's figures are industry estimates in nominal dollars, not adjusted for inflation, so they measure money spent, not quantities bought. Prices are a separate, parallel measure. In the US consumer price index from the Bureau of Labor Statistics (CPI-U, not seasonally adjusted), prices for pet services including veterinary rose 61% from September 2016 to September 2026, against about 40% for all prices and 27% for pet food and treats. The services series includes grooming and boarding as well as the vet, so it is not a measure of vet fees alone, and the two data sets use different time frames.
Insurance is the newest piece of the picture, and it comes from a different source. The North American Pet Health Insurance Association (NAPHIA) counts only dogs and cats. In the US, insured dogs and cats rose from about 4.0 million in 2021 to about 7.0 million at year-end 2025, a computed sum of NAPHIA's dog and cat counts. US in-force gross written premiums reached about $5.7 billion at year-end 2025 and, computed from NAPHIA's yearly growth rates, more than doubled since 2021. Even so, only about 4% of US dogs and cats were insured. These premiums are a different measure from APPA's sales figures and are not a slice of its $14.3 billion services category.
As of October 2026, the latest full-year APPA figures are for 2025, the latest NAPHIA figures are for year-end 2025, and the latest consumer price data are for September 2026. APPA's next yearly total is expected around March 2027 and NAPHIA's next report around June 2027.
The mechanism to keep in mind is that a nominal spending total moves with both prices and quantities, and APPA's figures alone cannot separate the two. Reading the spending chart next to the price index shows how much of the picture each measure can carry on its own.
Watch the short video: YouTube