What Happened to the S&P 500 After Every Midterm Since 1950
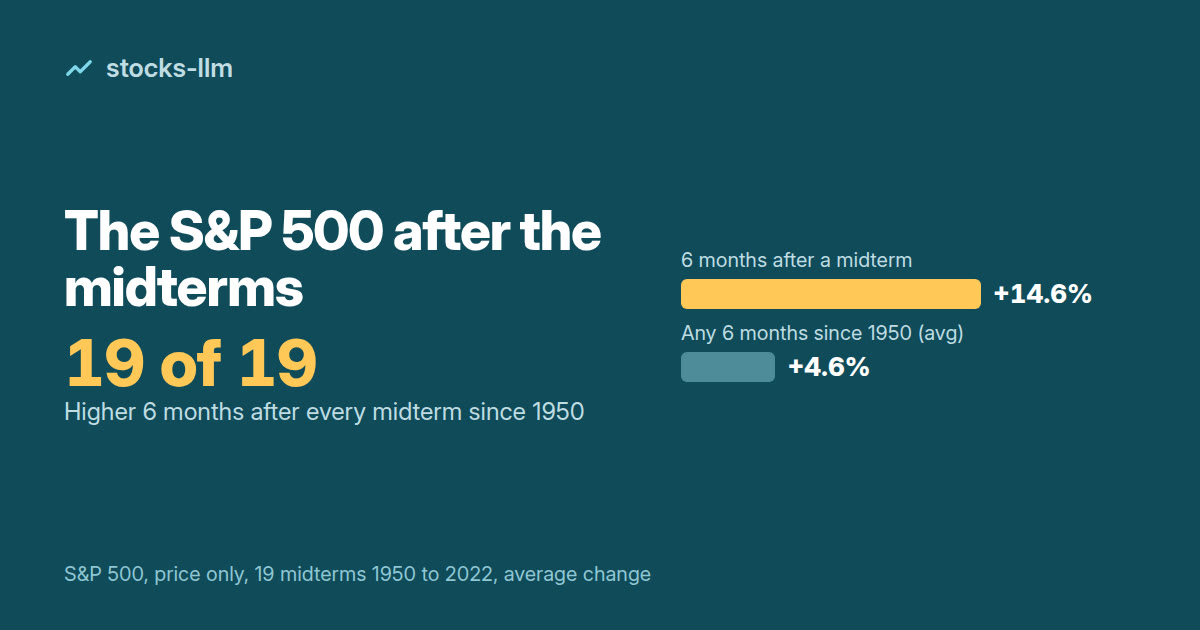
Six months after every US midterm election since 1950, the S&P 500 was higher than at the close before Election Day: 19 of 19 times, with an average gain of 14.6%. That figure is price only, with no dividends and no inflation adjustment.
The next midterms are on Tuesday, November 3, 2026. Midterms fall in the second year of a president's four-year term, and they come with a long-standing question about what the vote means for the S&P 500. To answer it, stocks-llm took the index's daily closes from January 1950 to October 23, 2026 and measured what happened around each of the 19 midterms from 1950 to 2022.
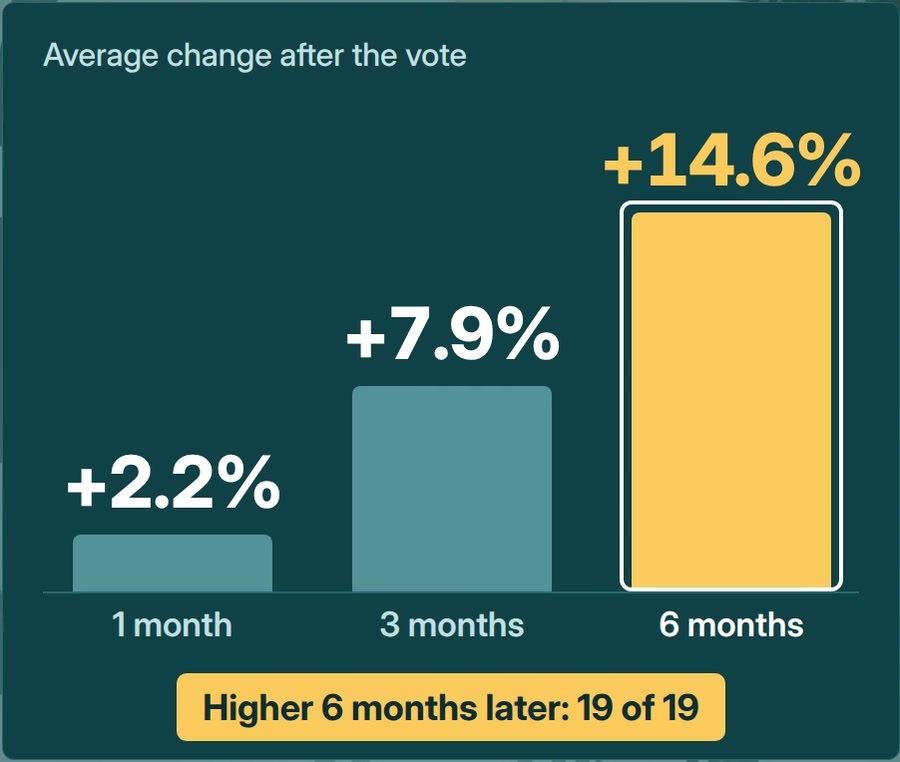
Each change starts from the close on the last trading day before Election Day and ends at the close on the same date 1, 3 or 6 months later. On that basis the S&P 500 was up 2.2% on average after one month, 7.9% after three months and 14.6% after six months. The count of gains rises with the horizon too: 16 of 19 at one month, 17 of 19 at three months and 19 of 19 at six months. The smallest six-month gain came after the 2002 vote, at 2.4%, and that was after the index sat 6.6% lower at the three-month mark.
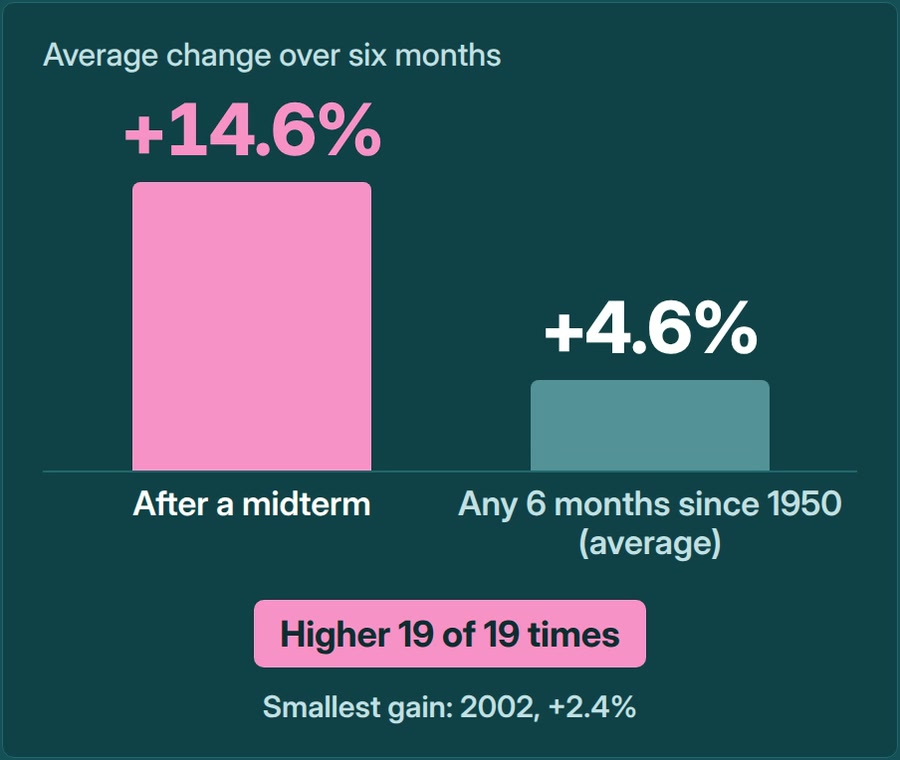
The six-month figure needs a baseline to mean anything. Across 19,198 overlapping six-month windows since 1950, the S&P 500 gained 4.6% on average and was higher 70.8% of the time. The post-midterm windows averaged well above that, and none of them ended lower. Still, 19 elections is a small sample, and the result belongs to the six-month horizon only: at one month the index was lower 3 times, and at three months 2 times.
The other side of the picture is the midterm year itself. Measured as the calendar-year change from December 31 to December 31, over the years 1951 to 2025, midterm years averaged a 3.7% gain, the weakest of the four years of a presidential term, while pre-election years averaged 17.2%. Midterm years have also been bumpy before the vote. The average biggest drop from a prior high, measured on daily closes from January 1 to the day before Election Day, was 17.0% in midterm years against 12.0% in the same window of other years. Oppenheimer Asset Management, writing on October 13, 2026, reported a drop of roughly 16% on average for every midterm year since World War II, consistent with that measure.
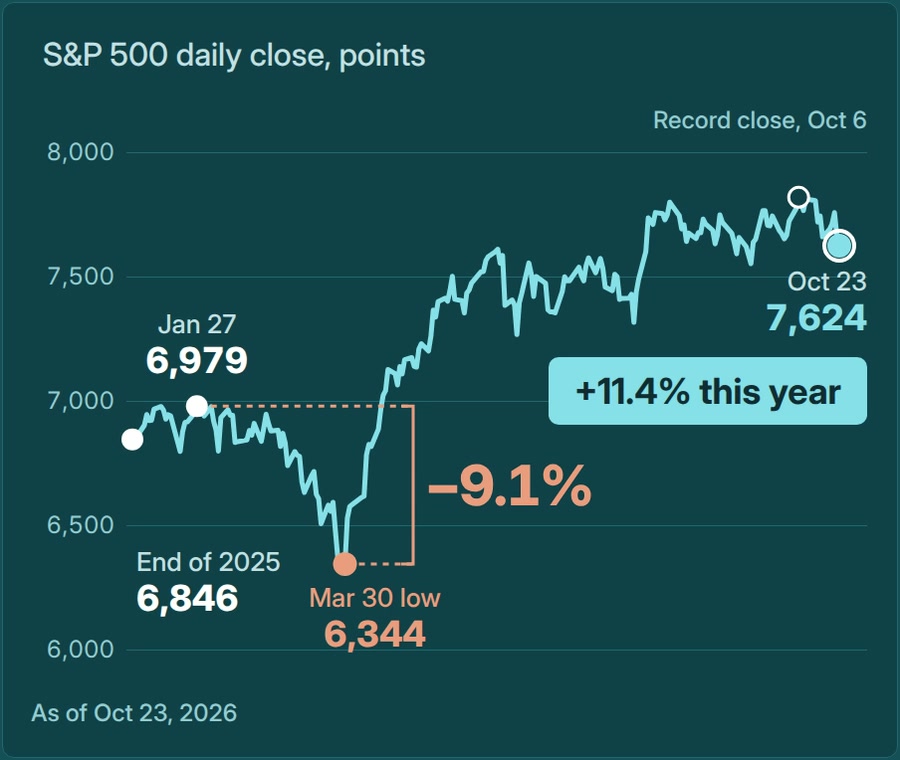
So far, 2026 has been milder than the average midterm year. The S&P 500's biggest dip this year ran from 6,978.60 on January 27 to 6,343.72 on March 30, a fall of 9.1%, well short of the 17.0% midterm average. As of the October 23, 2026 close of 7,623.68, the index was up 11.4% from the December 31, 2025 close of 6,845.50.
An average of 19 cases can be pulled up or down by a few large moves, which is why the count of 19 of 19 and the smallest gain of 2.4% say as much about the six-month history as the 14.6% average does. Past results describe those 19 elections and do not predict the next one.
Watch the short video: YouTube