How long Japan's stocks took to recover from the 1989 peak: 34+ years
Japan's Nikkei 225 took more than 34 years to get back to its 1989 peak: it closed at 38,915.87 on December 29, 1989, and did not close above that level again until February 22, 2024. That is about nine years longer than the S&P's worst wait, the 25 years that followed its 1929 peak.
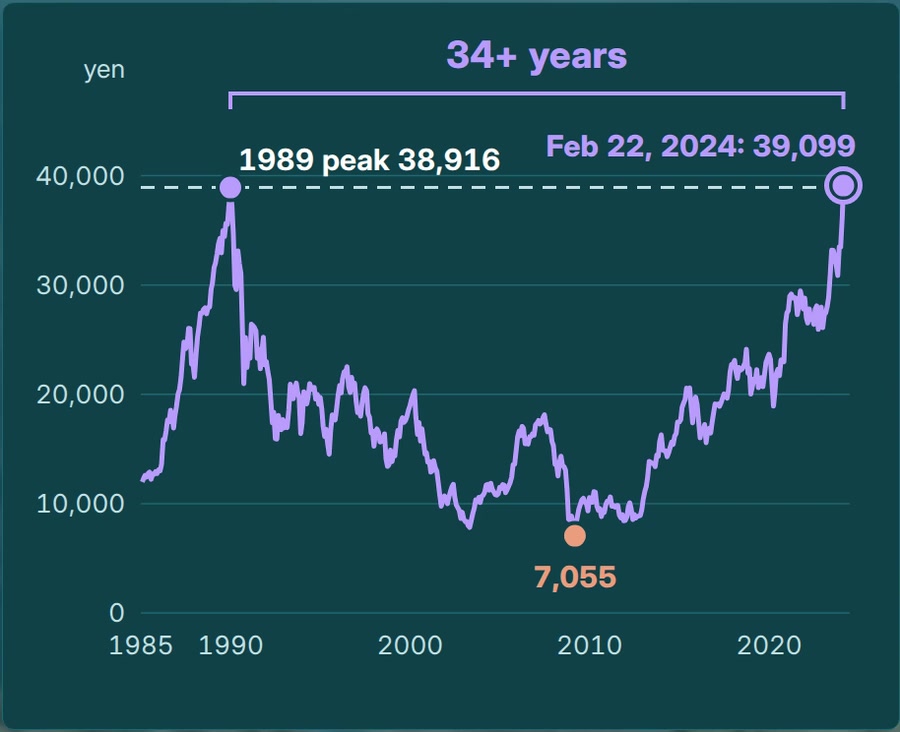
The Nikkei 225 is a price index of 225 large companies listed in Tokyo, published by Nikkei Inc. and quoted in yen. Through the 1980s it climbed steeply, and on the last trading day of 1989 it closed just under 39,000, the top of Japan's bubble. That close was the index's record for more than three decades, which makes it a useful test of a familiar idea: that a broad market index always comes back, and the only question is how soon.
Every Nikkei figure here is a daily close of the price index, in yen, before inflation. Intraday highs and lows are left out, so the comparison is close to close. On that basis the slide lasted more than 19 years. The lowest close came on March 10, 2009, at 7,054.98, about 82% below the 1989 peak. The first close above 38,915.87 came on February 22, 2024, at 39,098.68, which puts the full round trip at more than 34 years. No daily close in between topped the old peak, even though the index rallied several times along the way.
A price index leaves out dividends, and dividends change the picture. Nikkei Inc. said in October 2021 that its Nikkei 225 Total Return Index, which reinvests dividends, had reached a new high by February 2021, about 31 years after the end of the bubble period. Nikkei published the month, not the exact day or level, so the honest reading is "about 31 years", about three years sooner than the price index. It is still a very long wait, and it is measured in yen before inflation.
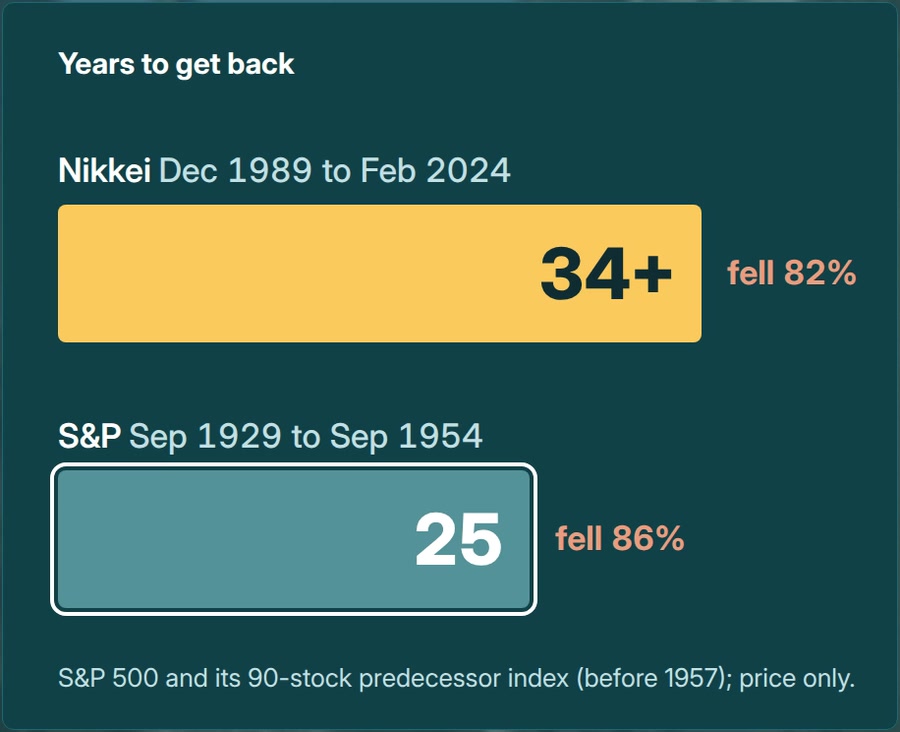
The comparison most people reach for is the United States. The S&P index, which before 1957 was the 90-stock predecessor of the S&P 500, peaked in September 1929, fell about 86% by June 1932 and first closed above its 1929 peak in September 1954, 25 years later. On a price only basis that is the S&P's longest wait in its daily history. A common misreading is that Japan's crash was the deeper one. The checked figures say the opposite: the S&P fell further, about 86% against about 82%, yet got back sooner. A deeper fall, a shorter wait. The depth of a decline and the length of the recovery are two different measurements.
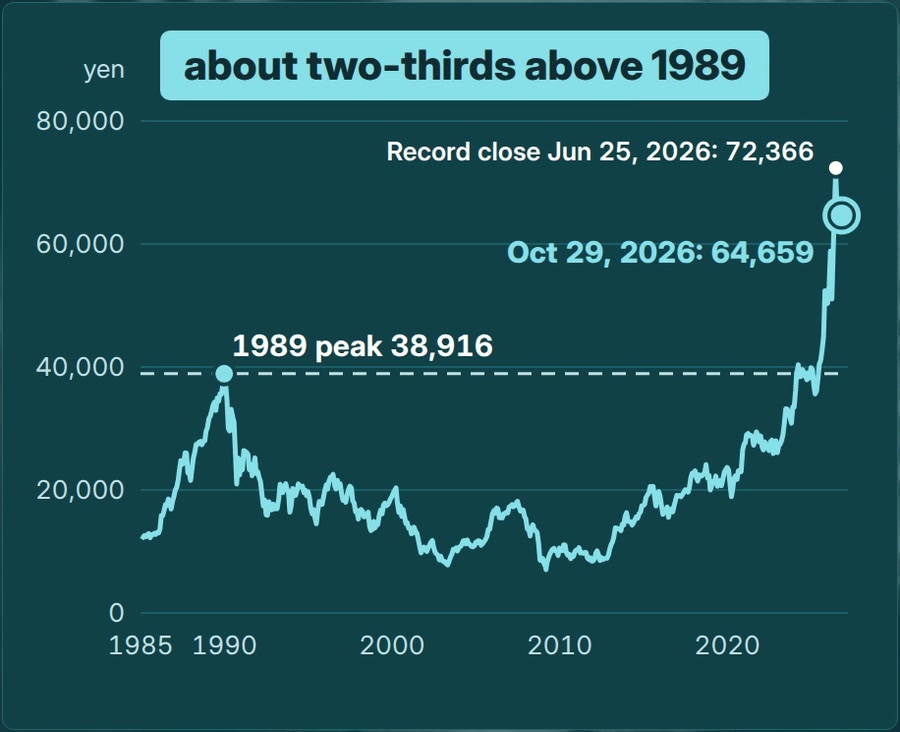
The 1989 level is no longer the Nikkei's record. The index set a record close of 72,366.34 on June 25, 2026, and as of October 29, 2026, it closed at 64,659.47, about two-thirds above its 1989 peak. Those are still daily closes in yen before inflation, and they move with every trading day, so the gap to the old peak is a snapshot rather than a fixed fact.
The recovery time of an index depends on how far it falls, how high it started and what the measure includes. Starting from a steep peak, a price index can stay underwater for decades, and counting reinvested dividends shortens that wait without removing it.
Watch the short video: YouTube